Intro
Amazon Simple Storage Service (S3) is a storage service that lets you store and access files of any size up to 5TB anywhere and at any time. Companies use S3 to store their data because it is highly scalable, reliable, and fast. In S3, the files you create and upload are stored in separate buckets and subfolders. As an administrator, you can add users and grant them varying levels of read and write privileges to your buckets.
However, using S3 with Tableau, a popular BI tool, is difficult and inconvenient. Because S3 is not a relational database, data engineers need to move the data from S3 into a data warehouse like Redshift and then create extracts of the data in order for Tableau to be able to run efficiently. However, with Dremio, you can run Tableau on your S3 data lake easily, eliminating the data pipeline and accelerating your time to insight.
Assumptions
To follow this tutorial, you should have Dremio and the ODBC driver already installed. If you don’t have them installed, go to the Dremio deployments page and pick the installations for your operating system. Also, we will work with Amazon S3 and Tableau Desktop, so you need to have them installed and configured as well. We also recommend you read Getting Oriented to Dremio and Working With Your First Dataset and get acquainted with Dremio.
Uploading data to S3
For this tutorial, we’ll be working with a dataset of 311 cases from the city of San Francisco, which includes geographical, time, and categorical data. If your data is already in a S3 bucket, feel free to skip this section. If you haven’t used S3 before, keep on reading.
First, you will want to create a bucket in S3. 
Enter the properties for your bucket and confirm creation. First, you will want to create a bucket in S3. 
Once you have created your bucket, you can create a subfolder entitled 311cases and upload your data to that folder. 
Connecting S3 to Dremio
After you have successfully uploaded your data, navigate to the IAM console and retrieve your access key ID and secret access keys. For more direction on how to find your access key, use Amazon’s documentation. 
Then, open Dremio and click on the + button near sources to add a new source. 
This will open a menu of all of the different sources Dremio can connect to. Today, we will be using Amazon S3. 
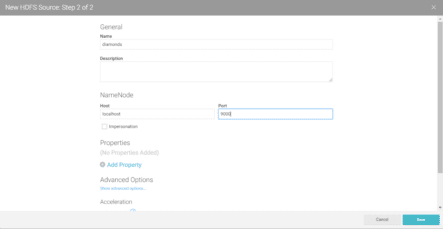
Enter your access key information to connect Dremio to your S3 bucket. 
Once you have successfully connected S3, navigate to the S3 source containing your data and configure your csv file. Click on extract field names and change the line delimiter so that your data is formatted properly.

Data curation in Dremio
Dremio exposes your data in a relational structure so that you can perform SQL queries on your data. You can also write SQL using Dremio’s intuitive user interface.
You can clean, integrate, transform your data in Dremio with built-in functions. You could, for instance, extract the time from one of the date and time columns simply by highlighting the time and clicking extract.


You can also convert your date strings into a date & time object by using a proper format string to match your dates.


Now that Dremio understands the date Opened column as a date & time object, we can sort and filter that column. Today, we’ll be looking at homeless concerns in San Francisco in 2008.
To filter the column by date, we can click the dropdown on the Opened column and use the slider to choose an interval of time. I’ve filtered the data for just incidents in 2008.

Next, we can filter our data by category. I’ve chosen to filter for “Homeless Concerns” for this visualization.

Finally, we want to convert latitude and longitude to a floating type. Currently they are being read as strings.

Visualizing S3 data in Tableau
Now, we are ready to visualize our data in Tableau. To export our data as a .tds file, click on Tableau in the right corner of the interface.

Since we’ve converted latitude and longitude to floats, they are now under measures. We can plug longitude into columns and latitude in rows to display all the records on the map. 
To distinguish records by neighborhood, we can drag the neighborhood dimension into color.

Now, we can tell that most homeless concerns are concentrated in three neighborhoods: the Tenderloin, SoMa, and the Mission.

If at any point we wanted to further transform or filter our data, we can go back to Dremio to do so. When we are ready to work in Tableau, we don’t need to export the .tds file again. Instead, because Dremio has an ODBC to Tableau, we can simply refresh our data, and the changes will be reflected in Tableau as well.

Conclusion
Today, we demonstrated how to visualize your S3 data in Tableau. With Dremio, your data lake on AWS doesn’t have doesn’t have to turn into a data swamp. By exposing your S3 data as SQL, Dremio makes it easy for you to write queries to curate and transform your data. With an ODBC connection to Tableau, you can then easily turn your data into visualizations and dashboards, accelerating your time to insight.


