335 minute read · October 3, 2024
Tutorial: Accelerating Queries with Dremio Reflections (Laptop Exercise)
· Head of DevRel, Dremio

In this tutorial, you'll learn how to use Dremio's Reflections to accelerate query performance. We'll walk through the process of setting up a Dremio environment using Docker, connecting to sample datasets, running a complex query, and then using Reflections to significantly improve the query’s performance.
Further Reading on Reflections
Step 1: Spin Up a Dremio Environment
First, let's get Dremio running locally. Use the following command to spin up a Dremio instance in Docker:
docker run -p 9047:9047 -p 31010:31010 -p 45678:45678 -p 32010:32010 -e DREMIO_JAVA_SERVER_EXTRA_OPTS=-Dpaths.dist=file:///opt/dremio/data/dist --name try-dremio dremio/dremio-oss
This will expose Dremio’s UI on port 9047 and set up the necessary ports for other services like JDBC and ODBC connections.
Step 2: Connecting to Data Sources with Dremio
One of the key benefits of Dremio is its ability to connect to a wide variety of data sources, including databases, cloud storage, and file systems. Dremio can federate queries across these data sources, allowing you to perform analytics across multiple systems without moving the data.
For this tutorial, we'll use Dremio’s Sample Source to access a sample dataset.
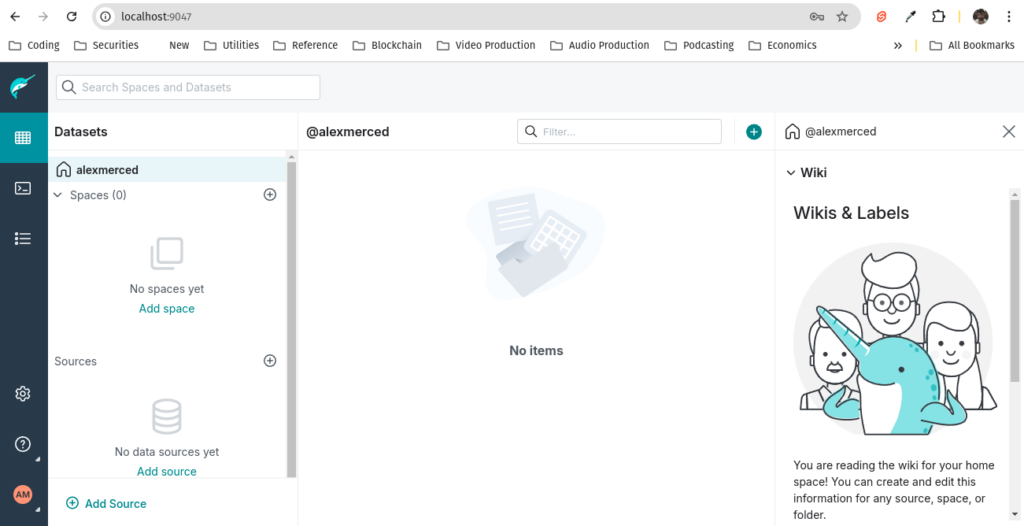
- Open your browser and go to
http://localhost:9047to access the Dremio UI. - Navigate to the Source section and add the Sample Source to your workspace. This will provide access to several preloaded datasets.

Step 3: Promoting the NYC Weather Dataset
Next, we'll use the NYC-weather.csv dataset from the sample source.
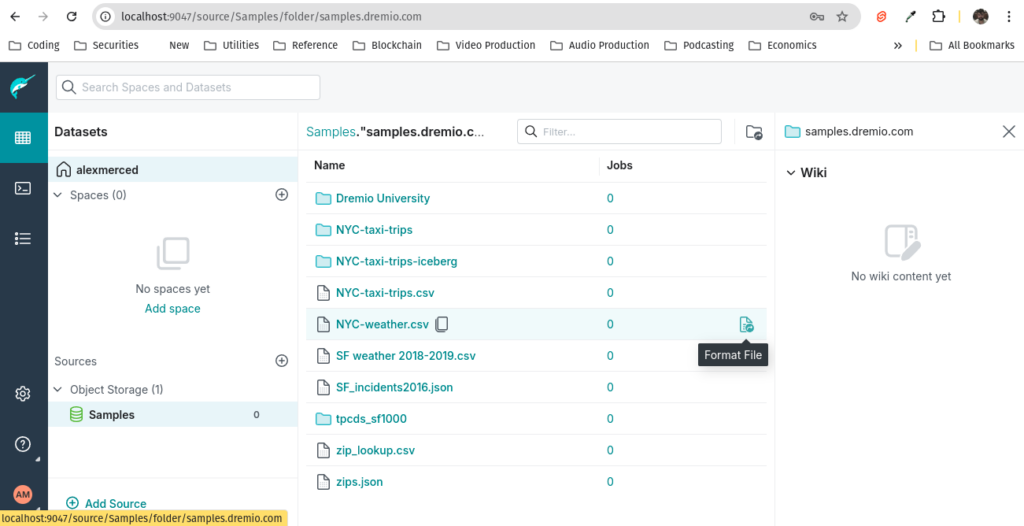
- Browse to the NYC-weather.csv file in the sample source.
- Click on the file and select Format to convert this file into a SQL-queryable dataset.
3. When formatting the dataset, make sure to select Extract Column Names so the first row of the file is used as the header.
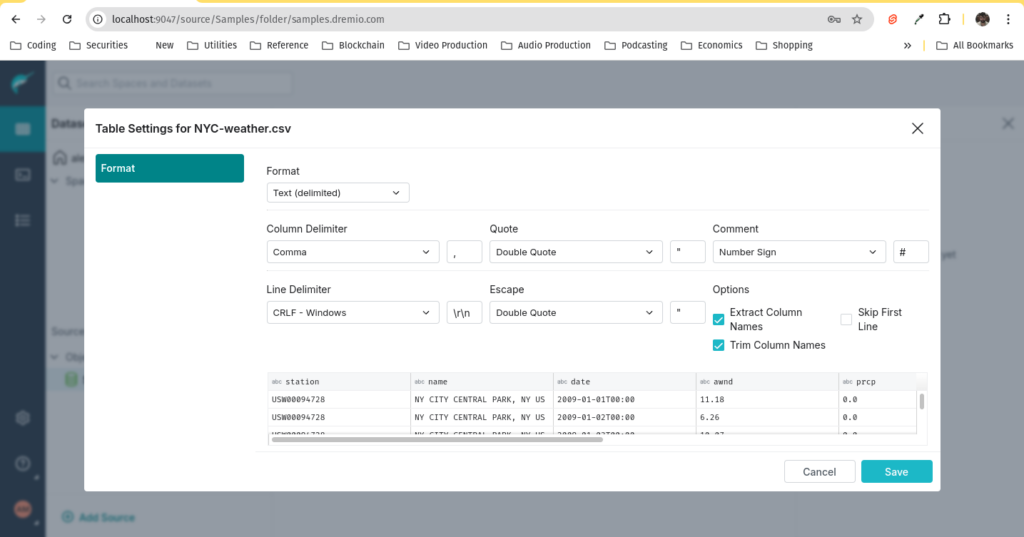
The schema of the dataset should look like this:
station: Stringname: Stringdate: Stringawnd: Stringprcp: Stringsnow: Stringsnwd: Stringtempmax: Stringtempmin: String
Step 4: Converting Data Types
By default, all fields in this CSV dataset are imported as strings since CSVs are schema-less. You'll need to convert some of these fields to appropriate data types to make the dataset more useful for analytical queries. We could do this with SQL but Dremio provides UI helps so users of any technical level can curate the data they need:
- Run the query to see the data in the data set.
- Convert the
datefield to a date type. - Convert
awnd,prcp,snow,snwd,tempmax, andtempminto float types.
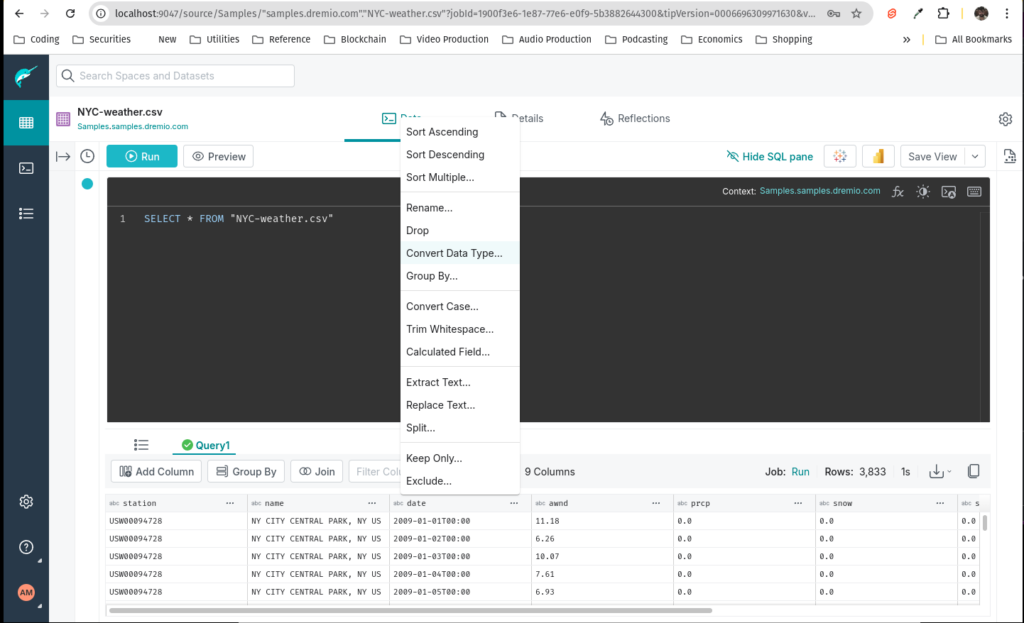
The resulting query with all the type conversions should look like this:
SELECT station, name, TO_DATE("NYC-weather.csv"."date", 'YYYY-MM-DD', 1) AS "date", CONVERT_TO_FLOAT(awnd, 1, 1, 0) AS awnd, CONVERT_TO_FLOAT(prcp, 1, 1, 0) AS prcp, CONVERT_TO_FLOAT(snow, 1, 1, 0) AS snow, CONVERT_TO_FLOAT(snwd, 1, 1, 0) AS snwd, CONVERT_TO_FLOAT(tempmax, 1, 1, 0) AS tempmax, CONVERT_TO_FLOAT(tempmin, 1, 1, 0) AS tempmin
FROM Samples."samples.dremio.com"."NYC-weather.csv" AS "NYC-weather.csv";
After making these changes, save the dataset as a view called "weather" to your "home" which is called "@username".
Now go back to the main data explorer and bring up this new view, Dremio allows you to create views from data across all the sources you connect.
Step 5: Writing and Running a Complex Query
Now that the data is ready, write a complex SQL aggregation query. Here’s an example that calculates average weather metrics grouped by month:
SELECT
  EXTRACT(MONTH FROM "date") AS "month",
  AVG(tempmax) AS avg_tempmax,
  AVG(tempmin) AS avg_tempmin,
  AVG(awnd) AS avg_wind_speed,
  SUM(prcp) AS total_precipitation,
  SUM(snow) AS total_snowfall
FROM
  "@alexmerced".weather
GROUP BY
  "month"
ORDER BY
  "month";
Run this query, it should take a few seconds to compute. Using reflections we can make this query run in sub-seconds.
Step 6: Creating an Aggregate Reflection
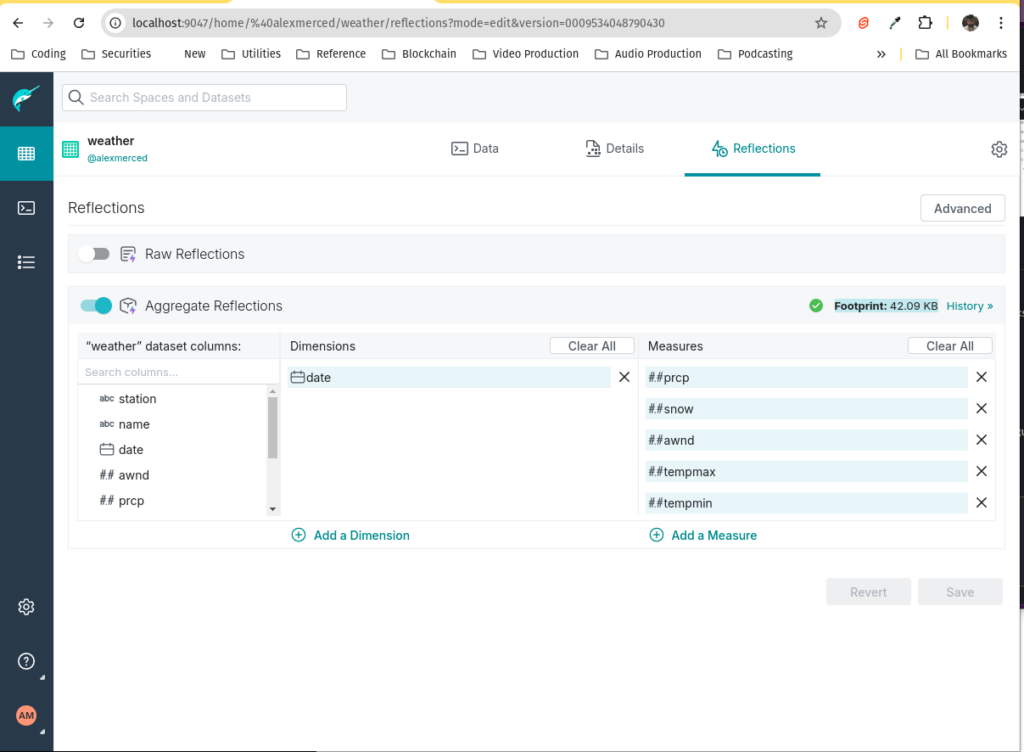
To speed up this query in the future, you can create an Aggregate Reflection.
- In the Dremio UI, click on "edit" for the dataset in the details bar on the left
- navigate to the Reflections tab and select Toggle On Aggregate Reflections.
- Select the view you created earlier as the base dataset.
- For the Dimensions, select the
datefield. - For the Measures, select the aggregated fields
tempmax,tempmin,awnd,prcp, andsnow. - Save the reflection and allow it to build. You'll see the footprint when done building.
Step 7: Running the Query Again
Once the reflection is created, run the same complex SQL query again. You should notice a significant improvement in performance, as Dremio now uses the reflection to speed up the query instead of recomputing the results from scratch. On the jobs page, you'll see the lightning bolt symbol representing a query accelerated by reflections. To see an even more dramatic example try running some aggregate query on the NYC Taxi Dataset in the sample data, but keep in mind that dataset is quite large (over 300 million records) so it may take a few minutes to run non-accelerated aggregations directly from your laptop.

To shut down the docker container
docker stop try-dremio
If you ever want to turn this container back on in the future
docker start try-dremio
Conclusion
With Dremio’s Reflections, you can dramatically accelerate complex queries without the need for excessive partitioning or additional data engineering. By intelligently managing reflections, you can optimize query performance, reduce compute time, and ensure that your data is always ready for fast, real-time analysis.
In this tutorial, we demonstrated how to set up Dremio, promote and format a dataset, create a complex query, and then use an Aggregate Reflection to optimize that query for better performance. With this approach, you can easily scale your data analytics workload while keeping query times low.
Further Reading on Reflections
More Hands-on Tutorials with Dremio
Sign up for AI Ready Data content
