16 minute read · March 6, 2024
BI Dashboards 101 with Dremio and Superset

· Senior Tech Evangelist, Dremio
Business Intelligence (BI) Dashboards are dynamic, data visualization tools used to display the current status of metrics and key performance indicators (KPIs) for an organization. Essentially, they provide a visual and interactive representation of data, enabling users to make informed decisions based on the latest information. BI dashboards pull data in from various sources, including databases, data lakes, and cloud services, to present a consolidated view of business operations. The importance of BI dashboards lies in their ability to transform complex data sets into intuitive, actionable insights, facilitating quick decision-making and strategic planning. In today's fast-paced business environment, swiftly accessing, understanding, and acting on data is a significant competitive advantage.
The Value of Direct Data Lakehouse Dashboarding
Creating BI dashboards directly from data stored in a data lakehouse offers numerous benefits. Traditional data warehousing approaches often require data to be moved and transformed multiple times before it can be used for analytics, introducing delays and potential for data inconsistencies. On the other hand, direct data lakehouse dashboarding allows organizations to tap into their raw, unprocessed data directly, ensuring that the insights gained are timely and reflect the most current data available.
Advantages include:
- Real-time Data Access: Direct querying of data lakehouses enables dashboards to display the most up-to-date information, which is crucial for time-sensitive decisions.
- Reduced Data Movement: By eliminating the need to move and transform data before analysis, organizations can streamline their data pipelines, reducing complexity and the risk of errors.
- Enhanced Data Governance: Accessing data directly from its source ensures that governance policies are consistently applied, improving data security and compliance.
- Scalability and Flexibility: Data lakes, designed to store vast amounts of structured and unstructured data, offer unparalleled scalability and flexibility. Direct lakehouse dashboarding leverages this strength, allowing businesses to adapt quickly to changing data analytics needs.
Introduction to Dremio
Dremio is a data lakehouse platform that offers a unique approach to simplifying data access and analytics across various sources. It enables organizations to perform SQL queries directly against their data lake storage, databases, and data warehouses without the need for data movement or duplication. This capability significantly accelerates the time-to-insight for data analysts and scientists, fostering a more agile and efficient data analytics process.
At its core, Dremio facilitates seamless integration with modern data lakes, providing tools for data exploration, curation, and acceleration. Its ability to support a wide array of data sources, from HDFS and S3 to relational databases, makes Dremio a versatile choice for organizations looking to harness the full potential of their data assets. Moreover, Dremio's architecture is designed to optimize query performance, leveraging advanced caching and query optimization techniques to deliver fast, interactive analytics experiences.
Key Features of Dremio:
- Direct Querying: Perform SQL queries directly on data lakes without pre-processing or moving data.
- Data Source Agnosticism: Connect to various data sources, offering a unified view of all data.
- Query Acceleration: Utilize Dremio's intelligent caching and optimization to speed up data access and analysis.
- Self-service Data Access: Empower data analysts and scientists with data discovery and exploration tools, minimizing IT dependency.
Dremio democratizes data access and ensures that organizations can maintain a single source of truth for their data, enhancing data integrity and governance. It empowers businesses to leverage their data lakes for real-time analytics and insights.
Introduction to Apache Superset
Apache Superset is an open-source business intelligence (BI) application that allows users to create and share interactive dashboards and data visualizations. As a modern, enterprise-ready BI web application, Superset is designed to be highly intuitive, offering a rich set of visualization types and a flexible, drag-and-drop interface for dashboard creation. Its ability to connect to virtually any SQL-based data source makes it a versatile tool for organizations of all sizes.
Superset's emphasis on ease of use and interactivity does not come at the expense of performance or scalability. It features a robust security model, integrating seamlessly with most authentication backends to ensure data protection and compliance. Whether exploring data, creating complex dashboards, or sharing insights across your organization, Superset provides a comprehensive set of tools to support a wide range of BI and analytics needs.
Highlights of Apache Superset:
- Rich Visualization Options: Offers a wide variety of charts, graphs, and dashboards to suit different analytical needs.
- Interactive Dashboards: Create dynamic dashboards with filters and drill-down capabilities for an in-depth data exploration experience.
- Easy Integration: Connects to any SQL-compatible data source, enabling direct data querying and visualization.
- Scalable and Secure: Designed to scale to handle large datasets and users, with robust security features for enterprise deployment.
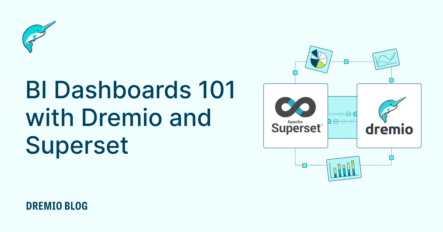
Combining Apache Superset with Dremio unlocks new possibilities for BI and analytics, allowing organizations to build interactive dashboards directly on top of their data lakes. This integration empowers users to leverage their data in real-time, facilitating informed decision-making and strategic insights.
Setting Up Apache Superset with Dremio
Integrating Apache Superset with Dremio for building BI dashboards involves several steps, beginning with the setup of Superset in a local Docker container.
This section guides you through the process, ensuring a smooth integration that leverages the powerful capabilities of both Dremio and Superset for real-time data analytics.
Note: For production, you’ll want to create your own custom docker image with Superset and the libraries to connect to Dremio and all your desired sources. I have created a custom docker image with the Dremio libraries installed for working with Superset. Here is a link to an example Dockerfile you can build your production image from.
Preparing the Environment
Before diving into the technical setup, ensure that Docker is installed and running on your laptop. Access to Dremio Cloud or a local instance of Dremio Software is also necessary. You can easily set up a local Dremio instance by following this guide. This setup is designed for evaluation and educational purposes, providing a hands-on experience with these tools.
Running Superset in a Docker Container
Start the Superset Container: Pull and run the custom alexmerced/dremio-superset Docker image, which is pre-configured for Dremio integration:
docker run -d -p 8080:8088 --name superset alexmerced/dremio-superset
Initialize Superset: After the container is up and running, execute the Superset initialization commands to set up the necessary configurations and metadata databases:
docker exec -it superset superset init
Access Superset UI: Open your web browser and navigate to http://localhost:8080/login/ to access the Superset login page. Use the default credentials (admin for both username and password) to log in (this is configured when the docker image is made).
Configuring Superset to Connect to Dremio
Within Superset, you'll need to establish a connection to Dremio to start building your dashboards:
Create a Dremio Database Connection: In Superset, navigate to the Data > Databases section and add a new database connection. Use the Dremio Flight connector URL format for either Dremio Cloud or a local Dremio setup:
dremio+flight://data.dremio.cloud:443/?token=<PAT>&UseEncryption=true
For Dremio Software
dremio+flight://<dremio-username>:<dremio-password>@<host>:32010/?UseEncryption=false
Ensure that the Personal Access Token (PAT) is URL encoded. This can be done through your browser's developer tools or an online service.
Test Connection: After configuring the connection details, use the "Test Connection" feature in Superset to ensure your setup is correctly connected to Dremio. (Possible issues is forgetting to URI Encode your token or your Dremio Engine being off while you test your connection)

Creating a Dashboard in Apache Superset
Once you've successfully connected Apache Superset to your data source, the next step is to create insightful dashboards to visualize your data. Here's a step-by-step guide to help you through the process:
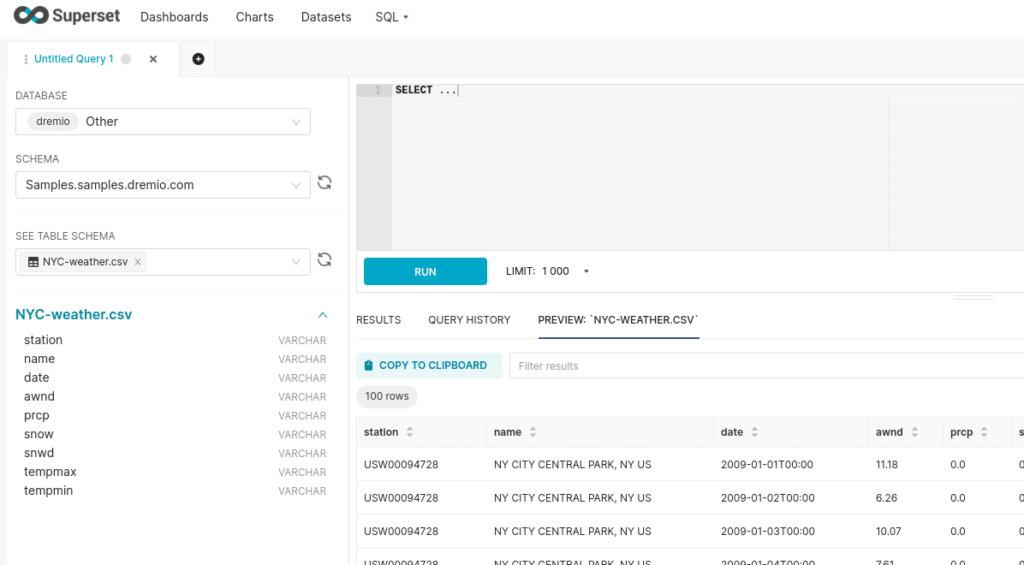
Step 1: Explore Your Data
Before you create a dashboard, spend some time exploring your data. Use the SQL Lab feature in Superset to run queries against your data and understand your available datasets. This step is crucial for determining what kind of visualizations will be most effective.
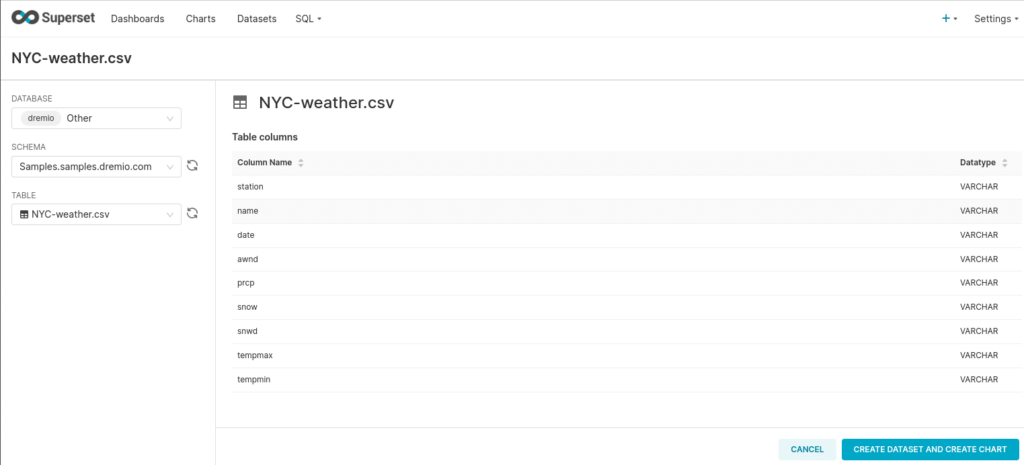
Step 2: Create a Dataset in Superset
- Navigate to the menu and select 'Datasets.'
- Click on the '+ Dataset' button to create a new dataset.
- Select your data source from the dropdown list and choose the table or view you want to use.
- Click on 'Add' to save the dataset.
Step 3: Create Charts
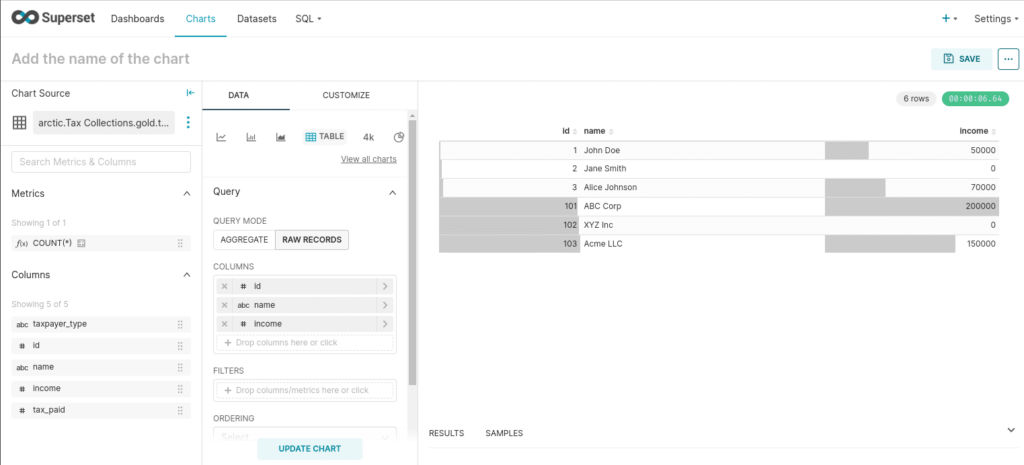
- Go to the 'Charts' section in Superset.
- Click the '+ Chart' button to create a new chart.
- Select the dataset you created from the dropdown menu.
- Choose a visualization type that suits your data and the insights you want to derive. Superset offers a variety of chart types, including line graphs, bar charts, pie charts, and more.
- Configure your chart by specifying the necessary fields, filters, and aggregation functions. You can customize the chart's appearance and behavior to fit your needs.
- Once you're satisfied with the chart, save it by giving it a name and adding an optional description.
Step 4: Create a Dashboard
- Now that you have one or more charts, you can combine them into a dashboard. Go to the 'Dashboards' section and click on the '+ Dashboard' button.
- Give your dashboard a name and an optional description.
- Add the charts you created to the dashboard by clicking on the '+ Chart' button within the dashboard editor. Select the charts you want to include.
- Arrange and resize the charts on your dashboard to create a coherent and visually appealing layout.
- You can also add markdown widgets for text, headings, or links to provide context or additional information alongside your charts.
Step 5: Customize and Save Your Dashboard
- Customize the dashboard's layout and appearance to suit your preferences and the needs of your audience. You can adjust the size and position of each chart and add dividers or spacing as needed.
- Once you're satisfied with the dashboard, save your changes.
Step 6: Share Your Dashboard
Apache Superset allows you to share your dashboards with other users or groups. You can set permissions to control who can view or edit your dashboard. Share the dashboard link with your colleagues or embed it in websites or applications to make your insights accessible.
Following these steps, you can create dynamic and interactive dashboards in Apache Superset, turning your data into actionable insights. Always remember to iterate on your dashboards based on user feedback and as your data evolves.
Step 7: Accelerating a Dashboard
If a dashboard isn't updating fast enough, enable an aggregate reflection on that dataset within Dremio to accelerate the dashboard for your users quickly.
Conclusion
By enabling efficient, real-time analytics directly from data lakes, Dremio provides organizations with the tools they need to navigate the complexities of big data, derive actionable insights, and maintain a competitive edge in the digital age. As businesses prioritize data-driven strategies, adopting Dremio is poised to become a key component of successful data analytics initiatives.
Learn More about Dremio’s Powerful SQL Lakehouse Query Engine
