25 minute read · July 1, 2019
Data Lake Analytics with Dremio and Power BI on ADLS Gen2
· Dremio Team

Intro
In this tutorial, we are going to show how to use Dremio in a bundle with PowerBI to perform visualization of data stored in Azure Data Lake Storage Gen2.
PowerBI is a great tool for data analysis and visualization developed by Microsoft. It consists of 3 main components: PowerBI Desktop, PowerBI service, and PowerBI for mobile. Power BI Desktop is used for dashboards creation, while PowerBI service and mobile version are used mainly for viewing the results of the work done in the desktop version. This platform supports a wide range of different chart types and even more ways to customize them. Furthermore, it allows loading own formatting styles if there is not enough among the built-in options. Here we will create several visualizations of the Corruption Perceptions Index dataset. To demonstrate the Dremio features regarding data curation, we intentionally split the dataset into 2 parts and join them later in Dremio.
Azure Data Lake Storage Gen2 is a storage option offered by the Azure cloud platform. It is optimized in terms of cost and also provides a high scalability level. At the same time, this storage solution supports the organization of files in a file system. So, it is possible, for example, to specify some settings for the whole directory with files, as well as apply them to a single file. You can read more about ADLS Gen2 in the official documentation.
Assumptions
We assume that you have the next instruments already installed and configured:
- Dremio 3.2
- Azure account
- Azure Storage Explorer
- PowerBI Desktop
Regarding the OS, PowerBI currently supports only Windows. You can install PowerBI in the virtual environment on other operating systems.
ADLS Gen2 preparation
In this section, we are going to demonstrate how to create ADLS Gen2 instance using the Azure portal and how to load data in the storage from the local machine.
Creation of the resource group in the Azure portal is the first step towards setting up the ADLS Gen2. Go to the Resource groups tab in the left-side menu, then click Add button. Fill in the form which you can see on the image below. After reviewing, confirm the creation of the new resource group.

If the creation if successful, you will see the following notification:

The next step is the storage account creation. Open All services tab, then click on Storage and select Storage accounts. After that, click Add.

On the next screen, you will be asked to fill the form for the new storage account creation.

Among important parameters you should specify in the form above are the subscription, resource group, storage account name, location, and account kind (StorageV2).
Now click on the Next: Advanced > button and ensure that Data Lake Storage Gen2 is enabled, as on the image below.

In the result, you will have the storage account in the list of available resources:

If you drill into the resource, you will see at least 2 pieces of evidence that this is the ADLS Gen2 storage account: file system and account kind (look at the image below).

Prior to uploading some files into storage, we need to create a file system. So, click on the File systems in the menu and then the Plus button to create a new file system:

Now your storage account is ready to get the files. Uploading can be performed using the Azure Storage Explorer. When you open it, on the tree structure from the left side of the window you should be able to see the name of the created file system (in our case, powerbifs).

Select the file system and click Upload. Then select the files on your local machine:

After the successful uploading, you will see the corresponding message about this and also the files will appear in the list of files available on the given filesystem:

List of successfully uploaded files:

On this step, ADLS Gen2 preparation process is completed.
ADLS Gen2 and Dremio connection
Now we need to connect Dremio and ADLS Gen2. To do this, click on the Add Source button on the homepage of the Dremio GUI:

Then, select the Azure Storage source:

On the next window, you will be asked to enter different parameters for the connection (name of the source, Azure storage account name, account kind, shared access key). The access keys can be found on the Azure portal if you click on the Access keys option in your storage account menu:

Here is how the window for different connection parameters looks like:

In the result of a successful connection, you should see both parts of the loaded dataset in the list of objects which the new source (corruption_powerbi) contains:

Data curation in Dremio
It’s the time to perform some manipulations with data in Dremio. First, we can notice that in both part1 and part2 the first row was not imported as we expected. We want the first row to be used as the column names.

We can deal with this problem in two ways. First is to rename all the columns directly. The second way is to go to the Dataset Settings and click on the Extract Field Names checkbox. Note, that the proper line delimiter for the file should be specified before this. In our case, the line delimiter is the new line sign: n. Then click the Save button.

To continue working with the dataset, we need to join the dataframes (part1 and part2). Go to part2 dataframe and click Join. Then, select the other dataframe with which you want to join the current dataframe (part1). As the next step, specify the columns which should be used to join the dataframes (outer keys, in our case, these columns are Country and Country2):

After joining, we don’t need duplicated columns, so we can drop them (there are a couple of such columns):

Also, we want to change the data types of some columns which store numbers but have a string (text) data type. With some columns there are no problems, we can just press on Abc button near the name of the column and select the data type we want to convert to:

We converted to integers all columns which contain integer numbers but in a string (text) data type. Nevertheless, there are 2 columns (Std Deviation of Sources and Standard Error) which we want to convert to float, but we can’t because the integer and decimal parts in values are separated by a comma, and Dremio expects a decimal point instead. So, we need to replace comma by point first. To do this, you should click on the little arrow near the column name and select the Calculated Field option. On the next step, we need to create a formula for the new field calculation. We can use different built-in functions. In our case, we are using the Replace function. This function takes the name of the source column, the part of the text we want to find, and the new text with which we want to replace the found text:

We performed similar manipulations for Std Deviation of Sources and Standard Error columns. All actions you performed with the dataframes in Dremio are reflected in the SQL query which Dremio generates automatically. Here is the SQL query which is responsible for the data curation after the dataframes joining:
SELECT "Number of Sources", "Std Deviation of Sources", CONVERT_TO_FLOAT("Standard Error", 1, 1, 0) AS "Standard Error", CONVERT_TO_INTEGER(Minimum, 1, 1, 0) AS Minimum, CONVERT_TO_INTEGER(Maximum, 1, 1, 0) AS Maximum, CONVERT_TO_INTEGER("Lower CI", 1, 1, 0) AS "Lower CI", CONVERT_TO_INTEGER("Upper CI", 1, 1, 0) AS "Upper CI", Country, CONVERT_TO_INTEGER(nested_2."Rank", 1, 1, 0) AS "Rank", CONVERT_TO_INTEGER(CPI2015, 1, 1, 0) AS CPI2015, Region, wbcode, CONVERT_TO_INTEGER("World Bank CPIA", 1, 1, 0) AS "World Bank CPIA", CONVERT_TO_INTEGER("World Economic Forum EOS", 1, 1, 0) AS "World Economic Forum EOS", CONVERT_TO_INTEGER("Bertelsmann Foundation TI ", 1, 1, 0) AS "Bertelsmann Foundation TI ", CONVERT_TO_INTEGER("African Dev Bank", 1, 1, 0) AS "African Dev Bank", CONVERT_TO_INTEGER("IMD World Competitiveness Yeaarbook", 1, 1, 0) AS "IMD World Competitiveness Yeaarbook", CONVERT_TO_INTEGER("Bertelsmann Foundation SGI", 1, 1, 0) AS "Bertelsmann Foundation SGI", CONVERT_TO_INTEGER("World Justice Project ROL", 1, 1, 0) AS "World Justice Project ROL", CONVERT_TO_INTEGER("PRS International Country Risk Guide", 1, 1, 0) AS "PRS International Country Risk Guide", CONVERT_TO_INTEGER("Economist Intelligence Unit", 1, 1, 0) AS "Economist Intelligence Unit", CONVERT_TO_INTEGER("IHS Global Insight", 1, 1, 0) AS "IHS Global Insight", CONVERT_TO_INTEGER("PERC Asia Risk Guide", 1, 1, 0) AS "PERC Asia Risk Guide", CONVERT_TO_INTEGER("Freedom House NIT", 1, 1, 0) AS "Freedom House NIT"
FROM (
 SELECT "Number of Sources", CONVERT_TO_FLOAT("Std Deviation of Sources", 1, 1, 0) AS "Std Deviation of Sources", REPLACE("Standard Error", ',', '.') AS "Standard Error", Minimum, Maximum, "Lower CI", "Upper CI", Country, nested_1."Rank" AS "Rank", CPI2015, Region, wbcode, "World Bank CPIA", "World Economic Forum EOS", "Bertelsmann Foundation TI ", "African Dev Bank", "IMD World Competitiveness Yeaarbook", "Bertelsmann Foundation SGI", "World Justice Project ROL", "PRS International Country Risk Guide", "Economist Intelligence Unit", "IHS Global Insight", "PERC Asia Risk Guide", "Freedom House NIT"
 FROM (
   SELECT "Number of Sources", REPLACE("Std Deviation of Sources", ',', '.') AS "Std Deviation of Sources", "Standard Error", Minimum, Maximum, "Lower CI", "Upper CI", Country, nested_0."Rank" AS "Rank", CPI2015, Region, wbcode, "World Bank CPIA", "World Economic Forum EOS", "Bertelsmann Foundation TI ", "African Dev Bank", "IMD World Competitiveness Yeaarbook", "Bertelsmann Foundation SGI", "World Justice Project ROL", "PRS International Country Risk Guide", "Economist Intelligence Unit", "IHS Global Insight", "PERC Asia Risk Guide", "Freedom House NIT"
   FROM (
     SELECT CONVERT_TO_INTEGER("Number of Sources", 1, 1, 0) AS "Number of Sources", "Std Deviation of Sources", "Standard Error", Minimum, Maximum, "Lower CI", "Upper CI", Country, data_joined."Rank" AS "Rank", CPI2015, Region, wbcode, "World Bank CPIA", "World Economic Forum EOS", "Bertelsmann Foundation TI ", "African Dev Bank", "IMD World Competitiveness Yeaarbook", "Bertelsmann Foundation SGI", "World Justice Project ROL", "PRS International Country Risk Guide", "Economist Intelligence Unit", "IHS Global Insight", "PERC Asia Risk Guide", "Freedom House NIT"
     FROM powerbi_space.data_joined
   ) nested_0
 ) nested_1
) nested_2
Now we can save the dataset in the powerbi_space with the name data_curated. If you don’t have a space for saving your data, you can create it from the Dremio home page. All you need is to specify the new space name.
In the end, we have our curated data saved in the powerbi_space. Now we can connect Dremio to PowerBI and import the data to this business intelligence platform.
PowerBI and Dremio connection
In this part of the tutorial, we will show how to establish a connection between PowerBI and Dremio.
If you click on the little arrow near the Tableau button, you will open a dropdown menu with the available tools for data analysis. PowerBI is among them:

After clicking on PowerBI, the pop-up window with the link to the instructions about the connection should appear.
According to the instructions, the connection should be done from PowerBI side. So, open your PowerBI Desktop and find the Get Data button on the External data group:

Select the Database tab and then find Dremio among the list of supported sources. Then click the Connect button:

The next step is to specify the IP address of the Dremio cluster. Since we have our Dremio cluster deployed on the local machine, we specify the localhost as the name of the host. Also, we select DirectQuery as the connectivity mode. This means that each action in PowerBI will generate a new query to Dremio.

The final step in connection is to select the data we want to import. We need to find the space where we saved our data in Dremio (powerbi_space) and select the needed dataframe (data_curated). Then click the Load button. Now, the data should be available for visualizations creation in PowerBI.

Building visualizations in PowerBI
PowerBI is able to create a lot of different visualizations. In addition, it supports custom visualizations which you can import from external sources. Here we will show you how to create several built-in visualizations as well as how to import and create a custom chart.
The first type of chart we are going to build is a stacked column chart. In order to create this and any other chart in PowerBI, you should click on the needed type of chart in the Visualizations group and then specify different parameters (required and optional) for plotting. In this case, we specify the Axis parameter to be Region and the Value parameter to be Average of CPI2015. This means that we want to display the average values of CPI2015 columns grouped by the Region. We can see that the highest average rating is among the countries in such regions as Western Europe/European Union and Asia/Pacific while the lowest average rating is in the Sub-Saharan Africa region.

The next type of graph we built is scatter plot. It will show the dependence between CPI2015 (Y Axis) and the Standard deviation of source (X Axis). In the pop-up windows, we want to show Details about the name of the Country. The logic of selecting the type of the chart and specifying the parameters is the same as for the previous chart.

We can see that there are some countries (for example, Qatar), which have a high CPI2015 rating, but the high Standard Deviation of Sources as well. This means that the organizations which compose the ratings disagree with each other about the rating for some countries. You can hover over different points in this scatter plot and explore what countries have high CPI2015 and low Standard Deviation of Sources or low CPI2015 and high Standard Deviation of Sources, etc.
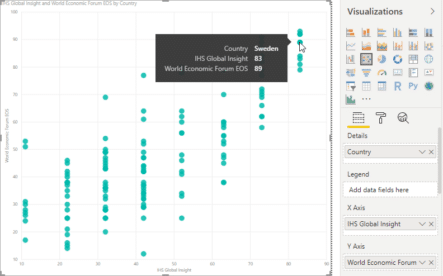
The next graph is also the scatter plot. You can see the direct relationship between 2 ratings: IHS Global Insight and World Economic Forum EOS. There is mismatching between these ratings for some countries. It can be interesting to explore this mismatching more and try to understand the reasons for such a situation. The logic of building this chart is the same as for the previous scatter plot.

The last type of graph we want to show is the candlestick. It is not supported by PowerBI natively, so we need to perform a custom import. Firstly, we need to download this custom visualization (candlestick). Then, click on the three dots under the visualizations panel, select Import from file, and pick the downloaded file for the candlestick.

The imported visualization should then appear in the list of the available charts. Select it to create a candlestick visualization:

Now we should specify all needed parameters for the visualizations, similar to what we did earlier for other chart types. We select the CPI2015 column as the values we want to visualize. For High and Low parameters we select Average of Upper CI and Average of Lower CI correspondingly. The Open and Close fields we leave blank. The resulting visualization you can see below. It reflects the relationship between CPI2015 and Average of Upper CI and Average of Lower CI values. It is obvious that the larger the value of the CPI2015 the larger values will Lower CI and Upper CI have.

Conclusion
In this tutorial, we described how to use Dremio with Azure Data Lake Storage Gen2 and PowerBI.
ADLS Gen2 was a place where we store the data, which then was imported to Dremio and curated. After the completion of all manipulations with data in Dremio, we connect PowerBI to Dremio and load the data to this solution for business analytics from Microsoft. We used PowerBI to create several visualizations of the data.


