10 minute read · October 2, 2019
Using Dremio and Python Dash to Process and Visualize IoT Data

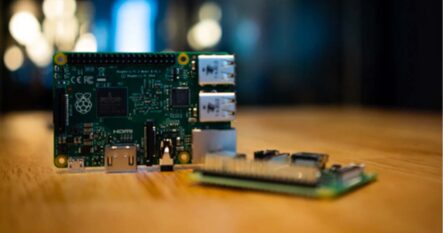
It has been a few months since I joined Dremio, however before joining I was curious to see what the product could do. Given that Dremio is open source and free to download I decided to give it a try. Yet, I didn’t want this project to be just a test on its sample data sources or a few clicks around the UI to get familiar with it. I wanted to do something that would give me a realistic sense of what tackling a real life data scenario would entail using Dremio. Since In my spare time I like to build random things with Arduino and Raspberry PI, I figured it would be a good idea to add Dremio into the mix.
The fundamental principle of the Internet of Things is to let devices gather as much data as possible and then send it to the internet for storage, processing and consumption. It is an idea that now more than ever can get done easily without breaking your wallet. That is why I decided to set up several IoT sensors around my house and also put a weather station outside to gather as much data as possible. This guide will walk you through the steps I took not only to put together this set up, but also how I gathered the data, stored it, processed it and visualized it using Dremio, several Azure services, and Python Dash.
The IoT Setup
The IoT market has experienced an exponential grown recently. This is especially true in the home automation category where a huge variety of devices to measure and control every aspect of our homes. This is primarily being driven by the availability of cheap and easy to use sensors and microcontrollers.

For this setup I’m using the following sensors inside of the house:
- 5 temp/humidity sensors
- 3 pressure sensors
- 2 light sensors
- 1 co2 sensor
- 1 VOC sensor

The weather station outside of the house contains the following sensors:
- Temperature
- Humidity
- Barometric pressure
- Rain
- Wind speed
- Wind direction
- UV index
A grand total of 19 sensors, continuously reporting back to an endpoint which appends data into a CSV file. I won’t go into detail about how to set all these sensors up since there is a plethora of tutorials online about how to get it done. However, let’s explore how the data flow that I designed for this project looks.

From the central endpoint, all sensor data is ingested into Azure Event Hub which allows me to ingest all the events coming from the different sensors. The setup is very simple, in the Azure console all you have to do is create an Azure Event Hub namespace and then an Event Hub instance.

Now that the event ingestion is all set, it is time to link the hub to Azure Stream Analytics which is going to enable me to store the data in ADLS. From here I will integrate all this data using Azure Data Factory and then I will go ahead and connect Dremio to the final data source.
Dremio Setup
In the spirit of taking full advantage of the Azure cloud, I deployed Dremio on Azure using the ARM template available on the deploy page. This will allow you to deploy dremio with a simple click and minimum configuration needed on your behalf.

Once the deployment is done, I pointed Dremio to my data source in ADLS Gen2, and set the refresh to 1 hour since that is the fastest that Azure Data Factory can process data without creating duplicate records.

Inside Dremio, I enabled “Raw Reflections” for the dataset that I’m working with to prevent having to constantly parse the JSON file that I’m reading from ADLS.
Data Curation
I took advantage of Dremio’s data curation features to prep the data for later consumption using Python. Some of the data types for the sensors needed to be changed, and I also needed to split fields such as ‘Device ID’ into ‘Sensor’ and ‘Device’. In addition to these changes, I joined the sensor dataset with a CSV file that I uploaded to enhance the final dataset with human readable room locations and device information.
Here is a sample of how the final dataset looks like.

In preparation for the visualizations that I wanted to include in the dashboard, I created aggregations for the values of each one of the sensors on different time frames such as last hour, last day and all-time.

Dash and Python
Now that the data is ready, it is time to create the Dash app to visualize it. After importing all the libraries and making sure that the ODBC connection between Python and Dremio can be established successfully, I can start putting the dashboard building blocks together.
A Python Dash app is very simple to construct, its basic components are an HTML layout, graphic components (charts) and Callbacks. For this dashboard I wanted to use gauge-like controls, so I leveraged Dash’s DAQ controls, after applying some changes to make it work with my data, the final code looks like the following, the final app can be found here:
Here are the graphic components (Time, Temperature, Humidity, Pressure, and Co2 levels)
current_date = dbc.Card([
   html.H4("Current Date", className="card-title"),
   dbc.CardBody([ daq.LEDDisplay(
 value=ts_str
) ])]
)
current_time = dbc.Card([
   html.H4("Current Time", className="card-title"),
   dbc.CardBody([ daq.LEDDisplay(
 value=ts_str2
) ])]
)
temperature = dbc.Card([
   html.H4("Temperature", className="card-title"),
   dbc.CardBody([ daq.Thermometer(
   min=0,
   max=50,
   value=float(temp_val),
   showCurrentValue=True,
   units="C"
   )])]
)
humidity = dbc.Card([
   html.H4("Humidity", className="card-title"),
   dbc.CardBody([daq.Gauge(
       showCurrentValue=True,
       units="%",
       value=float(humidity_val),
       max=100,
       min=0,
   )])]
)
pressure = dbc.Card([
   html.H4("Pressure", className="card-title"),
   dbc.CardBody([daq.Gauge(
       showCurrentValue=True,
       units="kPa",
       value=float(pressure_val),
       max=1200,
       min=900,
   )])]
)
And here is the final result.

Conclusion
Dremio is the data lake engine that allows you to run fast queries on your data lake, without the need to move data anywhere. In this case, I connected my IoT ecosystem to Dremio and was able to capture and join data from different sources and further analyze it using Dash without copying or extracting data out of its original storing source. Additionally, I was able to create an ODBC connection to Python Dash which allowed me to gain insights from my data at the speed of thought.
This scenario is just a sample of a wide variety of use cases that you can use Dremio and your favorite data science or BI tool to take advantage of your data lake. To take a deeper dive on how to use Dremio and Python Dash to visualize your data, take a look at this tutorial.
Stay tuned for more!


