Intro
Power BI is a powerful business intelligence platform. It is known for the abilities to connect to various data sources, tools for aggregating and analyzing data, and for the rich library of visualizations with many styling options.
Today we will show you how to use Power BI with Azure Data Lake Store (ADLS) which is one of the most popular storage products for massive datasets. We will use Dremio to simplify all of the necessary accessing and analyzing our data in an easy way, while providing high performance across a range of queries.
Assumptions
We assume that you have Dremio and ODBC driver installed; if not, go to Dremio’s deploy page, and pick the installations for your operating system. Also, we will work with Azure Data Lake Store, so you must have Microsoft account to follow this tutorial. If you don’t have one, you can use their free one month trial. Finally, you must have Power BI installed and configured. We also recommend you read Getting Oriented to Dremio and Working With Your First Dataset and get acquainted with Dremio.
Loading data into Azure Data Lake Store
For this tutorial, we will be using Backblaze Hard Drive Dataset that provides basic information and statistics for different hard drives. In particular, we are interested in the data for the first quarter of 2016 and 2017. Each of the quarters is represented by a set of CSV files. Our goal is to join these CSV files and look at the information for the two years as well as compare the situation between 2016 and 2017.
Download the necessary files and open Azure portal. Then click Create a resource and select Data Lake Store in the storage menu.

Provide all the necessary information - name the store, select a subscription, resource group, location, and pricing, enable encryption and click Create.
Next, click on the store, go to Data Explorer, and create a new folder named 2016. In this folder, click Upload and select the files for this year.

Do the same for 2017 so that we have two years of data to analyze.
Connecting Azure Data Lake Store to Dremio
Now we need to connect Azure Data Lake Store to Dremio. Let’s begin with creating a new source by clicking on the New Source button in the main UI in Dremio. Next, choose Azure Data Lake Store as the source type. As you see, we need some additional information from Azure to make the connection.

You can read more in Dremio documentation or in our previous tutorial.
Long story short, you have to provide:
- Resource Name which is the name of you Data Lake Store.
- Under the application registration, you will find Oauth 2.0 Token Endpoint.
- After creating new application registration, you will find the Application ID.
- And a password that you can generate in the registered app. Make sure to save it as you will need the password later.
After this, you also need to grant Azure Data Lake Store access. Click on Access control (IAM) and then choose Add.

Select Owner as the Role and find the name of the application you registered above. Click Save.
Now, we can finally connect to Azure Data Lake Store in Dremio. However, there is one more step that should be made, after the source has been successfully created. Go back to the source configuration and add the property with the name fs.adl.impl.disable.cache and the value false. You will need to provide the password again.
Data curation in Dremio
To begin with, we need to convert our files into Dremio datasets. We don’t want to have so many files, and for now, we would like to make only two out of them - one with the information for 2016, and the other one for 2017. Luckily, Dremio allows making this fast and easy. Simply hover over the folder and click on the icon at the very right to go to the Dataset Settings menu, as shown on the picture below.

In the Dataset Settings menu, choose Text (delimited) format with a Comma field delimiter, LF Unix/Linux line delimiter, and select to extract field names among the options.

Now, after you click Save, you will be able to query all the files as if they were in a single table. Very convenient!

However, the file is very large and, in fact, we will not use all the data, so let’s leave only the columns that interest us, namely: date, model, serial_number, failure, and smart_9_raw. The last column shows how many hours our processor actually exists. Failure is equal to 0 if nothing happened with the drive on that day, and to 1 in the opposite case.
In order to leave only the required columns, we can manually select “Drop” on the column menu for each column, or we can enter the following query in the SQL editor.
SELECT "2016"."date" AS "date", serial_number, model, failure, smart_9_raw
FROM harddrives."2016"
After that, click on Save as in the upper right corner of the screen and select the previously created Drives Space.

Perform the same procedure for 2017. The proper code from the SQL editor will look like this:
SELECT "2017"."date" AS "date", serial_number, model, failure, smart_9_raw
FROM harddrives."2017"
Now, after we saved our two datasets, we can unite them into one called fulldata. For that, we have to create a new query. You can do this by clicking on the button next to the dataset as shown below.

In order to combine two datasets, you can write the following SQL query:
SELECT *
 FROM Drives."2016"
 UNION
 SELECT *
 FROM Drives."2017"
Another way we could have done this would be to place all the two folders 2016 and 2017 into a common folder, and then define the formatting for the common folder as we did above. Dremio treats all the files in a folder as one common data source, including sub-directories. With the approach shown above, you can see how dealing with similar data in different structures could be handled.
Now, we need to specify the proper types of the variables. Namely, convert failure and smart_9_raw to integer type by clicking on the data type next to the variable name and selecting Integer in the pop-up menu.

Also, we want to distinguish data by months and years. So, we want to create two new variables from the date column, which is very easy to do with the help of Dremio. Let’s start with the variable that will represent months. First of all, convert the date column to the appropriate type. Select convert to Date, choose the right date format and click Apply.

Then, click on Add Field and create the month field as shown below.

Similarly, we can create the year column by adding a variable with YEAR(“date”) calculated field. Note, as we do this work we are not moving data from ADLS into Dremio. Instead, we are defining transformations that will be applied each time a query is issued to Dremio. In other words, queries are always returning “fresh” data from ADLS.
After all the preparations we can finally go to the visualization part. The final SQL editor should look like this:
SELECT nested_0."date" AS "date", MONTH("date") AS "month", nested_0."year" AS "year", serial_number, model, failure, smart_9_raw
FROM (
 SELECT TO_DATE(nested_0."date", 'YYYY-MM-DD', 1) AS "date", nested_0."year" AS "year", serial_number, model, CONVERT_TO_INTEGER(failure, 1, 1, 0) AS failure, CONVERT_TO_INTEGER(smart_9_raw, 1, 1, 0) AS smart_9_raw
 FROM (
   SELECT *
   FROM Drives."2016"
   UNION
   SELECT *
   FROM Drives."2017"
 ) nested_0
) nested_0
Configuring the connection
Now we need to connect Power BI to Dremio. At the time of writing, Dremio is not yet preconfigured in Power BI, so you will need to use a custom ODBC driver. We expect this to change in the second half of 2018.
To enable Dremio’s ODBC driver, open Power BI, click File in the upper left corner, select Options and Settings and then go to Options menu. Next, go to Preview features tab and toggle the checkbox near the Custom data connectors. Click OK.

Now restart Power BI. After that, click Get data and select the Database option. Among the databases, you will find Dremio. Click Connect.

Write the right cluster node (in case of running Dremio on the local machine write localhost) and select DirectQuery as a connectivity mode. This means that each click in Power BI will issue a new, live query to Dremio.

Next, enter your Dremio username and password, then select the data that you want to visualize and click Load.

Building visualizations
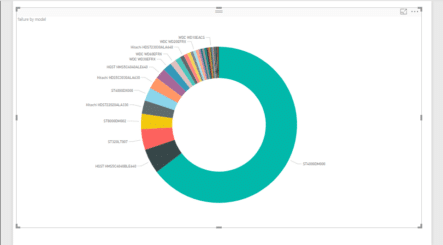
Now we are ready for building visualizations. Let’s start by building a donut chart that will show the connection of failure depending on the model of the drive. For that, click on the respective visual and put model into legend property and failure into values.


Next, we want to compare failures during each month of 2016 and 2017. A good choice for that comparison is stacked bar chart. If you pick date for axis option, month for legend, and sum of failure for value, you will get the following image.

Finally, we want to look at the distribution of the hard drives usage duration for our data, and we can do this with the help of a histogram. It’s a custom visualization, so you need to download it from the website. Then, click on the three dots under the visualizations panel, select Import from file, and pick the downloaded file for the histogram.

Then, for this histogram, put smart_9_raw into value and Count of smart_9_raw into frequency. As a result, we have the following visualization.

Conclusions
In this tutorial, we showed how you can easily visualize data from Azure Data Lake Store with Power BI and how Dremio helps with establishing the connection and making all the necessary data preparations during this process. Moreover, we demonstrated how Dremio simplifies what seems to be complicated tasks and enables many necessary actions with its user-friendly interface and with the convenient SQL editor.
If you’re working with data on Azure, you are probably using Azure Data Lake Store along with SQL Data Warehouse and other services. Dremio makes it so you can easily access all of the data from these services through one uniform, high-performance interface that includes a comprehensive catalog of all the data that is easy to search and find datasets. In addition, Dremio’s Data Reflections allow you to accelerate your queries by up to 1000x. You can read more about Data Reflections in the documentation, and you can learn how to use Data Reflections in this tutorial.


