The Results
Increases visibility and transparency
By integrating data silos, Henkel has dramatically increased data visibility and transparency, providing one source of truth for their business data. “Back in 2016, we would come to meetings and everyone would bring their own charts. We would spend the first 15 minutes of the meeting to bring the different charts together in a meaningful way. It took a lot of time,” Rana recalls. “Today our data quality is much higher, and the facts are clearer. We can leverage data across different functions, which we were not able to do before. When you have this capability, you can generate valuable insights to bridge the gap between supply chain planning and production.”
Cost savings through data-driven productivity improvements
In the past, when production planners were asked how many bottles of laundry detergent the line could produce per minute, they would typically make a conservative estimate of the line speed/capacity, not wanting to overpromise.
With significantly increased visibility in their production capacity, Henkel can base their planning on reality. “Once we had dynamic data planning tools, we started to compare plan speed vs. actual speed and saw a huge gap in our Overall Equipment Effectiveness (OEE), a key metric that measures how efficiently our production lines are running,” Rana says.
“We now have live, dynamic parameter settings in our planning tool, which has resulted in a >10% OEE increase since the introduction of the system. This is huge. We have 33 production plants with around 400 lines, with 250 connected in real time. It’s a huge productivity increase and advantage, and just one example of how data drives cost savings,” says Wolfgang Weber, Head of Digital Transformation Laundry and Home Care.
Reduces computing and maintenance costs
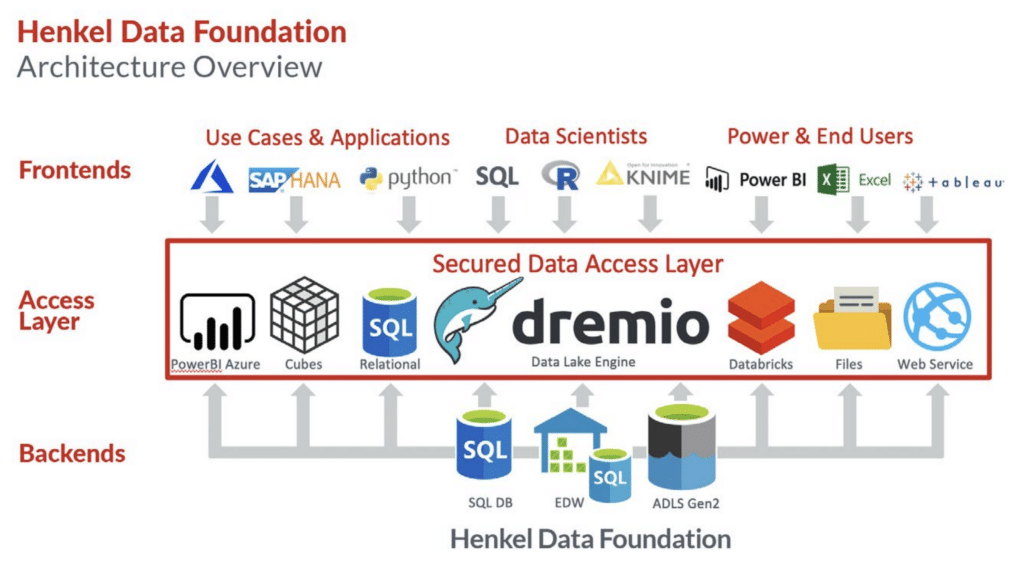
Previously, Henkel had been extracting data from multiple sources to Tableau because Tableau could not connect natively to multiple data sources. The scale of data was exploding at such a massive pace that Henkel would need to invest in hardware every six months to continually expand computing power and maintenance. It was becoming hard to justify these numbers that were not hitting any supply chain KPI.
“If you want a stable environment, you need something in between that connects to the data sources, and Tableau just connects to one. Dremio solved that problem, which has been huge in terms of maintenance and cost,” Rana says. “Now that loads are managed by Dremio, we no longer need to keep expanding our computing hardware. This had a big impact in terms of cost savings.
Reduces query times by 30X
The old system only had one specific dashboard with a live connection to a 3.5 billion-row dataset. If you wanted to do a query with a specific filter in Tableau, for example looking at a forecast for one brand, it would take 3-4 minutes to execute a query, which was an extremely long time to wait for an answer.
Using Dremio, Henkel reduced its query time 30x, from 3-4 minutes to 8 seconds. “End users immediately noticed the increase in query speed. It was so much faster that some people thought we must be dropping some data or searching through less data,” Rana says.
Dremio also enabled Henkel to clean up and improve the quality of their data. “There were big structured datasets with a lot of noise in the data,” he says. “We used Dremio to optimize the data with reflections, exploration, aggregation and partitions. That capability is only available in Dremio.
The Laundry & Home Care division now has >500 Tableau dashboards where business users can get fast answers to practically any supply chain query about demand and supply planning, production or inventory and use those insights to make rapid and informed business decisions.
Going forward, Dremio will be used as the backbone for a wide range of upcoming projects. “We are seeing a fastgrowing Dremio community within Henkel, and are convinced of the value of the tool,” Zeutschler says.

